If You Are A Digital Marketer, Converting Leads into Opportunities is Critical to a Successful Customer’s Journey
Often, no single conversion rate tells the whole story of the customer journey. Suppose a digital marketing campaign attracts large numbers of visitors to the website; that might be viewed as a successful campaign. But if a small number of those visits results in a sale or lead, that may not be a success if your goal is strictly revenue.
Businesses should constantly study their conversion rates to assess how well their digital marketing campaigns deliver new sales or leads. If you don’t track the correct conversion rates and analyze relationships between different conversion rates, then there’s a danger that the results appear better than they are.
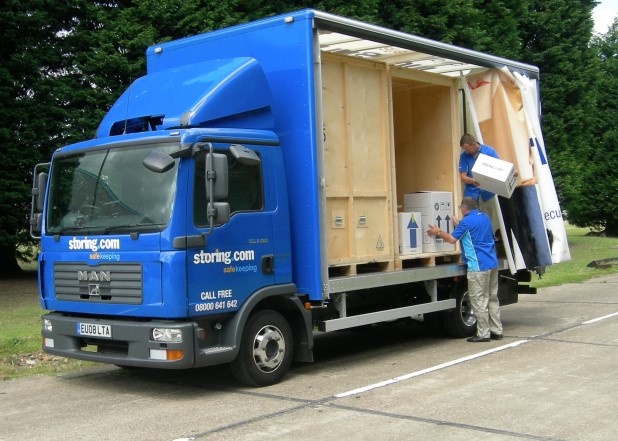
Here is a real-life example of a self-storage company called Storing.com. Their goal was to convert visitors to the website who submitted requests for quotes. In this example, the first part of the conversion funnel is purely online search marketing – a combination of Google pay-per-click Ads and search engine optimization.
Here are the different stages of a potential customer’s journey:
Level 1: Awareness
Potential customers first become aware of the company brand name Storing.com when it appears in the Google search listings, whether sponsored, organically, or both. We know the website’s search visibility is good for the relevant target search terms and locations.
Level 2: Interest
We also know that the average clickthrough rate (CTR) is reasonable, thanks to previous testing and optimization of the text displayed in the Google search listings on both organic and sponsored ads. People are interested in the company’s service and competitive pricing structure, so they click through to the website.
Level 3: Engagement
Engagement levels are less easily categorized because people enter the website on different pages. Some pages are trendy, but others receive few visitors or good visitor numbers but have low engagement rates. Where do they spend time – how much time are they looking at products, pricing, or other pages?
Level 4: Goal Conversion
Fortunately, the conversion rate is high for the button click (event) that takes visitors from multiple pages on the website to the page where they can fill in a form to get a quote for a storage unit. At the last count, 14.5% of visitors wanted a quote. In one recorded period, the website received visits from 30,680 people, and 4,448 wanted a quote. That provides us with the conversion rate via a simple bit of maths: 4448/30680 = 14.5%
Is this Good News or Bad News in A Customer’s Journey?
The conversion rate is not alarming considering that for an eCommerce site. In my experience, the average conversion rate is 2.5 – 3.0%.
The services and prices offered by this self-storage company are attractive. Although it is not an e-commerce business, we can still glean useful information by comparing it with e-commerce conversion rates.
This essential metric for the company was not being tracked as a goal in Google Analytics. That’s a missed opportunity.
Keep in mind that only a percentage of visitors wanted a quote. You want to know how many people filled out the form, but the more important metric is who clicked the “Submit” button and requested a quote.
When we dug a bit deeper into the data, we found that only a tiny percentage of the 4,000+ visitors to the page containing the quote form did indeed click “Submit.”
The website lost potential customers between deciding they wanted a quote and requesting one. Our analysis revealed that this was due to outdated assumptions about online buying behavior and simply too many mandatory fields on the form that had to be completed to get a quote.
What we learned
The key message here is that businesses may not be tracking and analyzing all the necessary goals at the different levels of their conversion funnel.
Check the goals set up in your own Google Analytics account and make sure they provide a complete picture of the user journey. Your customer’s journey needs to be measured against your objectives.
What are the top five pieces of information you should know to understand how to measure conversion rates at different points along a customer’s journey through an e-commerce site?
- Define the customer journey: Identify the key stages in the customer’s journey through your e-commerce site, such as browsing, adding items to the cart, and completing a purchase.
- Set conversion goals: For each stage of the customer journey, set specific conversion goals, such as the percentage of visitors who add items to their cart or complete a purchase.
- Track user behavior: Use tools such as Google Analytics to track user behavior on your site, including which pages they visit and their actions.
- Analyze data: Use the data collected to analyze your site’s performance and identify areas where conversion rates are low.
- Test and optimize: Use A/B testing and other optimization techniques to improve conversion rates at each customer journey stage.
This work requires a skilled professional with experience. You may want to do this yourself, but you can quickly move up the learning curve when guided by an experienced practitioner.
This is a guest post from Ditto Digital. The company was founded in 2009 and provides various digital marketing services, including Content Marketing, SEO, PPC, and Conversion Rate Optimisation. The company uses in-depth data analysis and best-practice processes to enable businesses to find new customers nationally and internationally.
You can set up a time to chat with me about your marketing challenges using my calendar. Email me jeffslater@themarketingsage.com Call me. 919 720 0995. The conversation is free, and we can explore if working together makes sense. Watch a short video about working with me.
Photo by Adam Winger on Unsplash


